Today, after the US market closes, NVIDIA Corporation (NASDAQ:) reports its fiscal year Q226 results—and rarely have euphoria and skepticism collided so sharply.
Before we get to the technical numbers, let’s take a quick look at the fundamentals:
Nvidia posted $46.7 billion in revenue in its second fiscal quarter—a 6% increase from Q126 and 56% year-over-year. The data center segment accounted for $41.1 billion, also up 56% from the previous year.
Source: InvestingPro
The data center segment—the core of Nvidia’s story—is expected to deliver about $48.8 billion. Profitability expectations are equally strong: a 73.7% gross margin, 65.9% operating margin, and roughly $30.5 billion in net income.
Consensus EPS stands at $1.25. But the real performance pressure comes from what’s ahead: Nvidia’s January Guide for the current fourth quarter, where the market is already pricing in aggressive growth.
Analysts expect $61.8 billion in revenue, a 74.5% gross margin, a 67.6% operating margin, and around $34.9 billion in net income. Data center revenue is also projected to climb further, to about $56.2 billion.
In short: The bar has been set higher than ever before.
- Nvidia is only about 14.5% below its record high from the end of October – not a crash, but rather a breather in an intact upward trend.
- Option prices are signaling an expected movement of approximately ±7.2% today. From around $181, the theoretical range extends to roughly $200 up or $170 down.
- And we know that in four of the last five earnings reports, Nvidia’s figures have fallen by an average of 2.4% – despite record numbers.
How to Trade the Report – Technical Numbers
Investing.com has recently launched a feature that may change the game for technical traders: an AI-powered chart analysis tool that lets you pull technical levels, signals, and trading setups directly onto the chart.
Here’s how to access it:
Open Investing.com, type “Nvidia” in the search bar at the top, go to the NVDA stock page, and scroll to the chart.
Now select your timeframe – from the 1-minute chart for event traders to the daily or weekly chart for swing-oriented investors who want to position themselves around the numbers.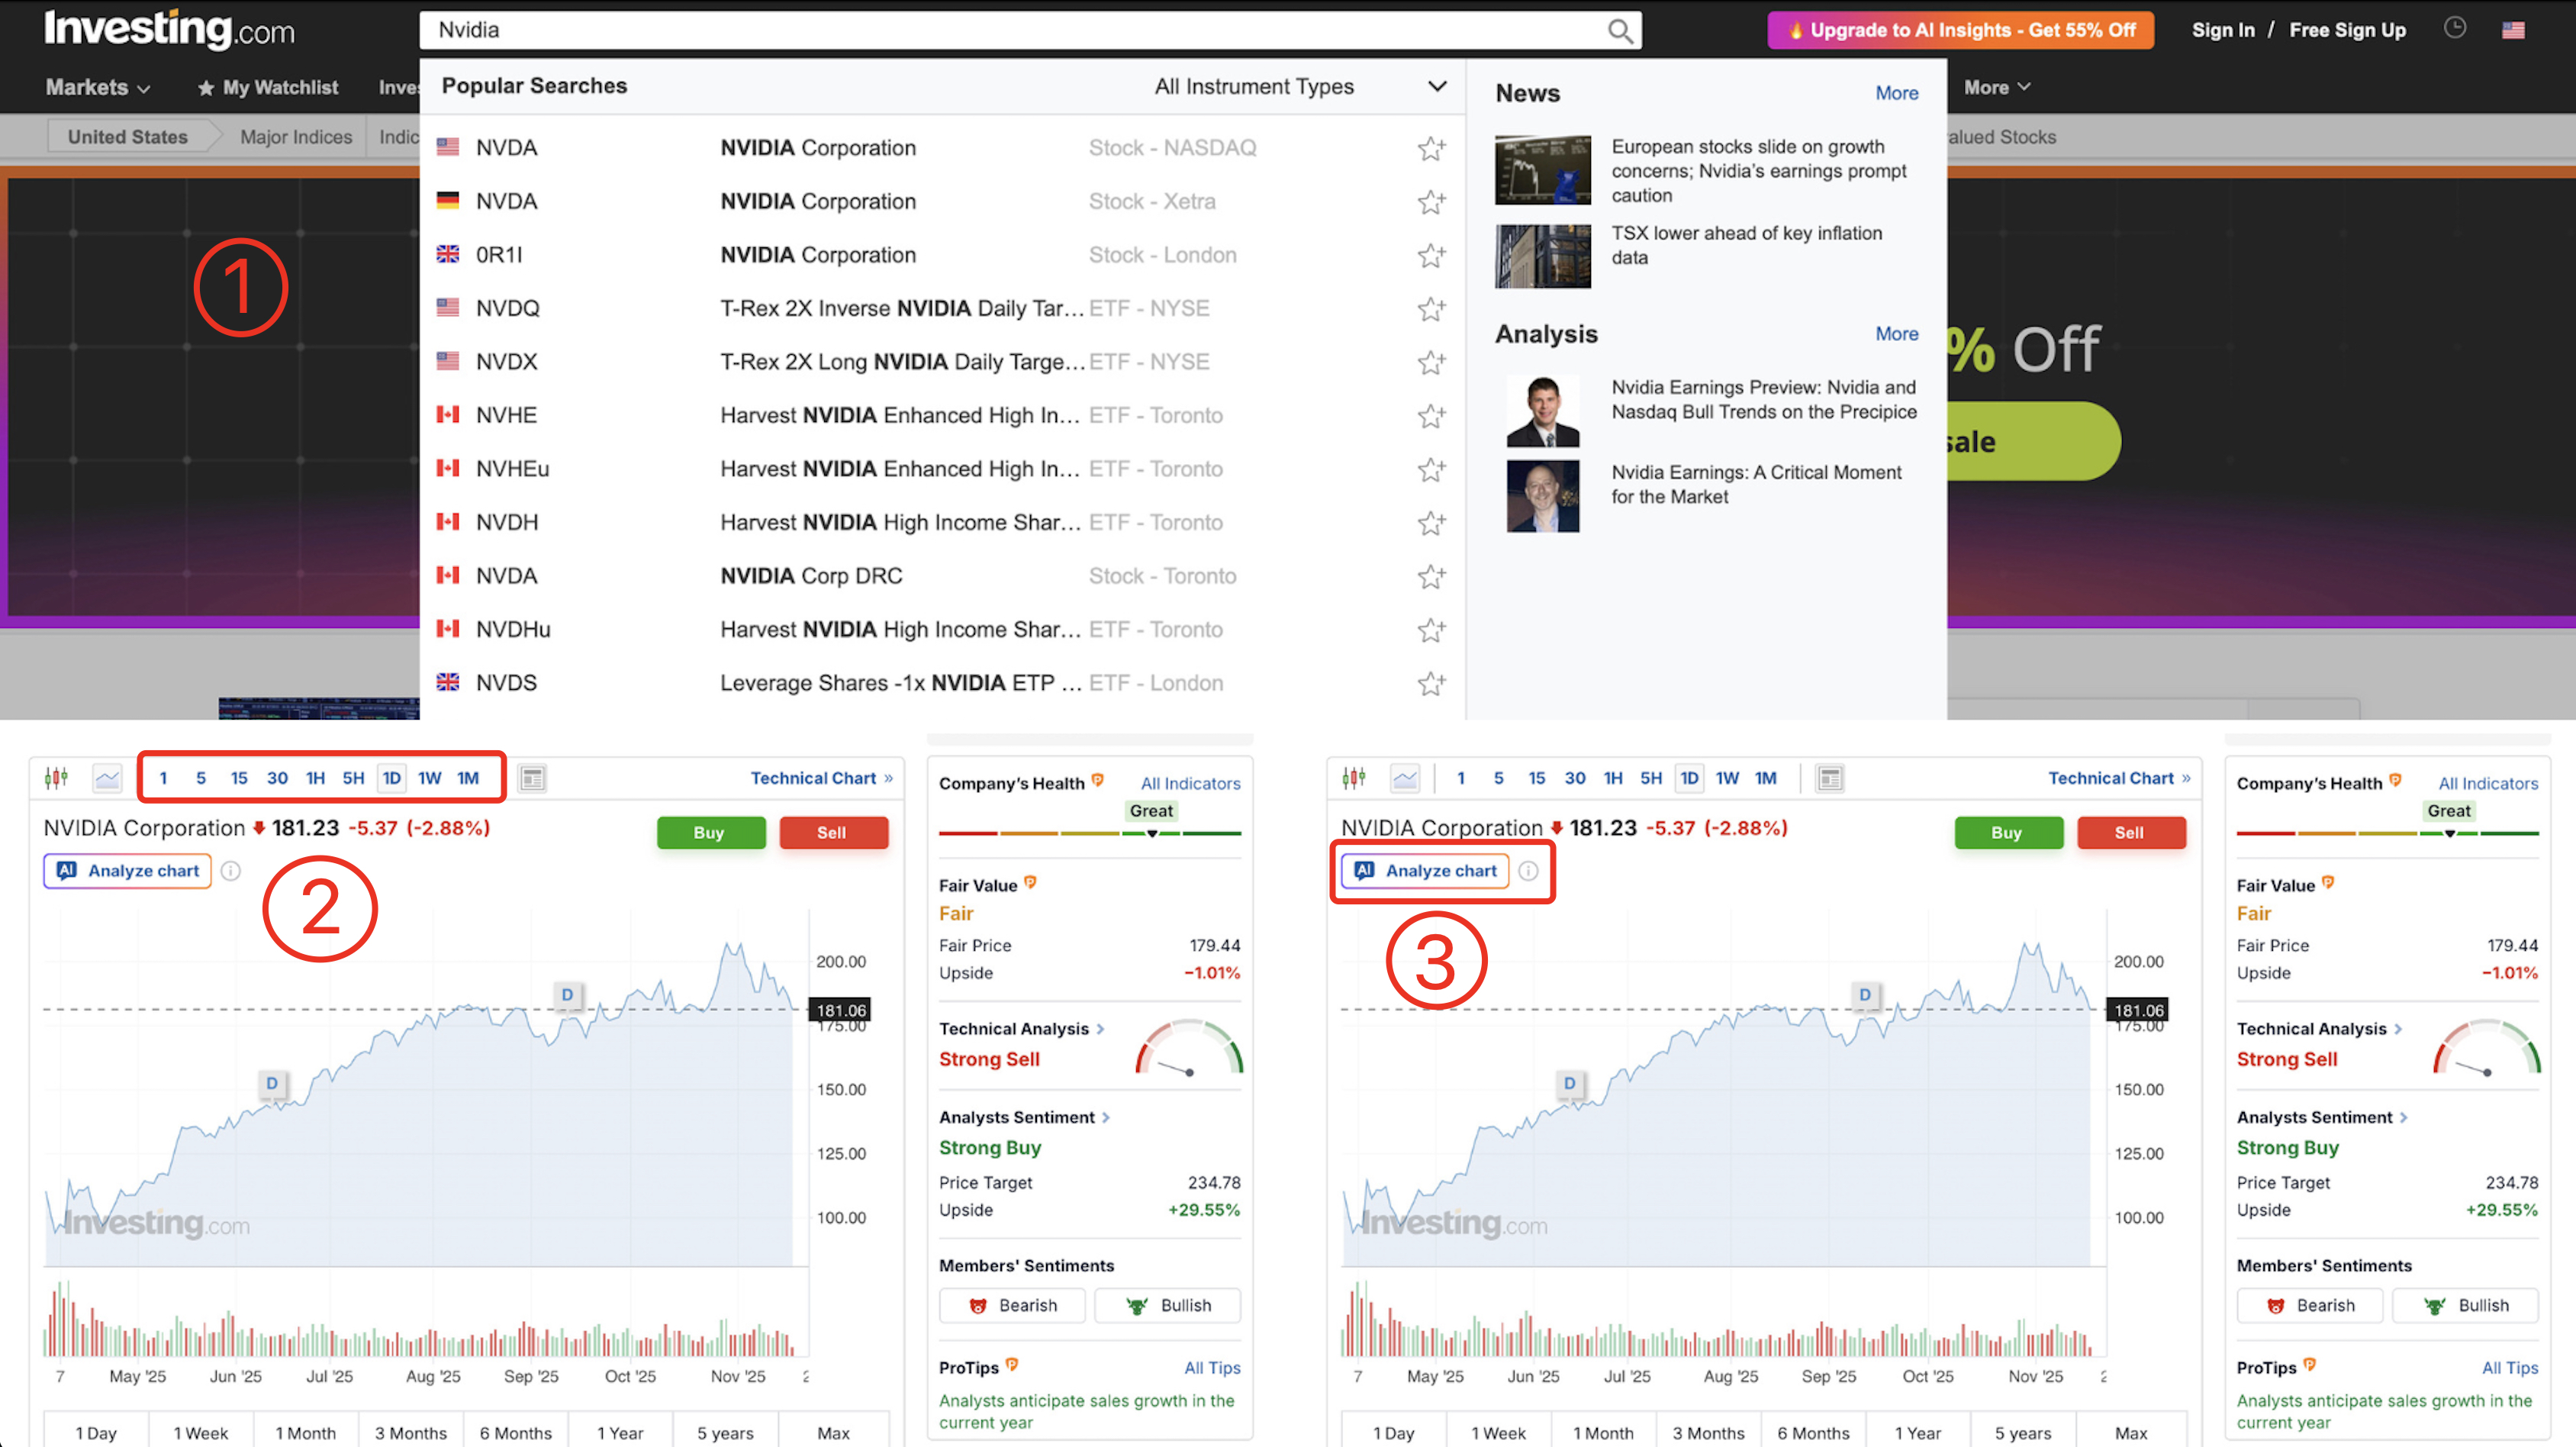 Source: Investing.com
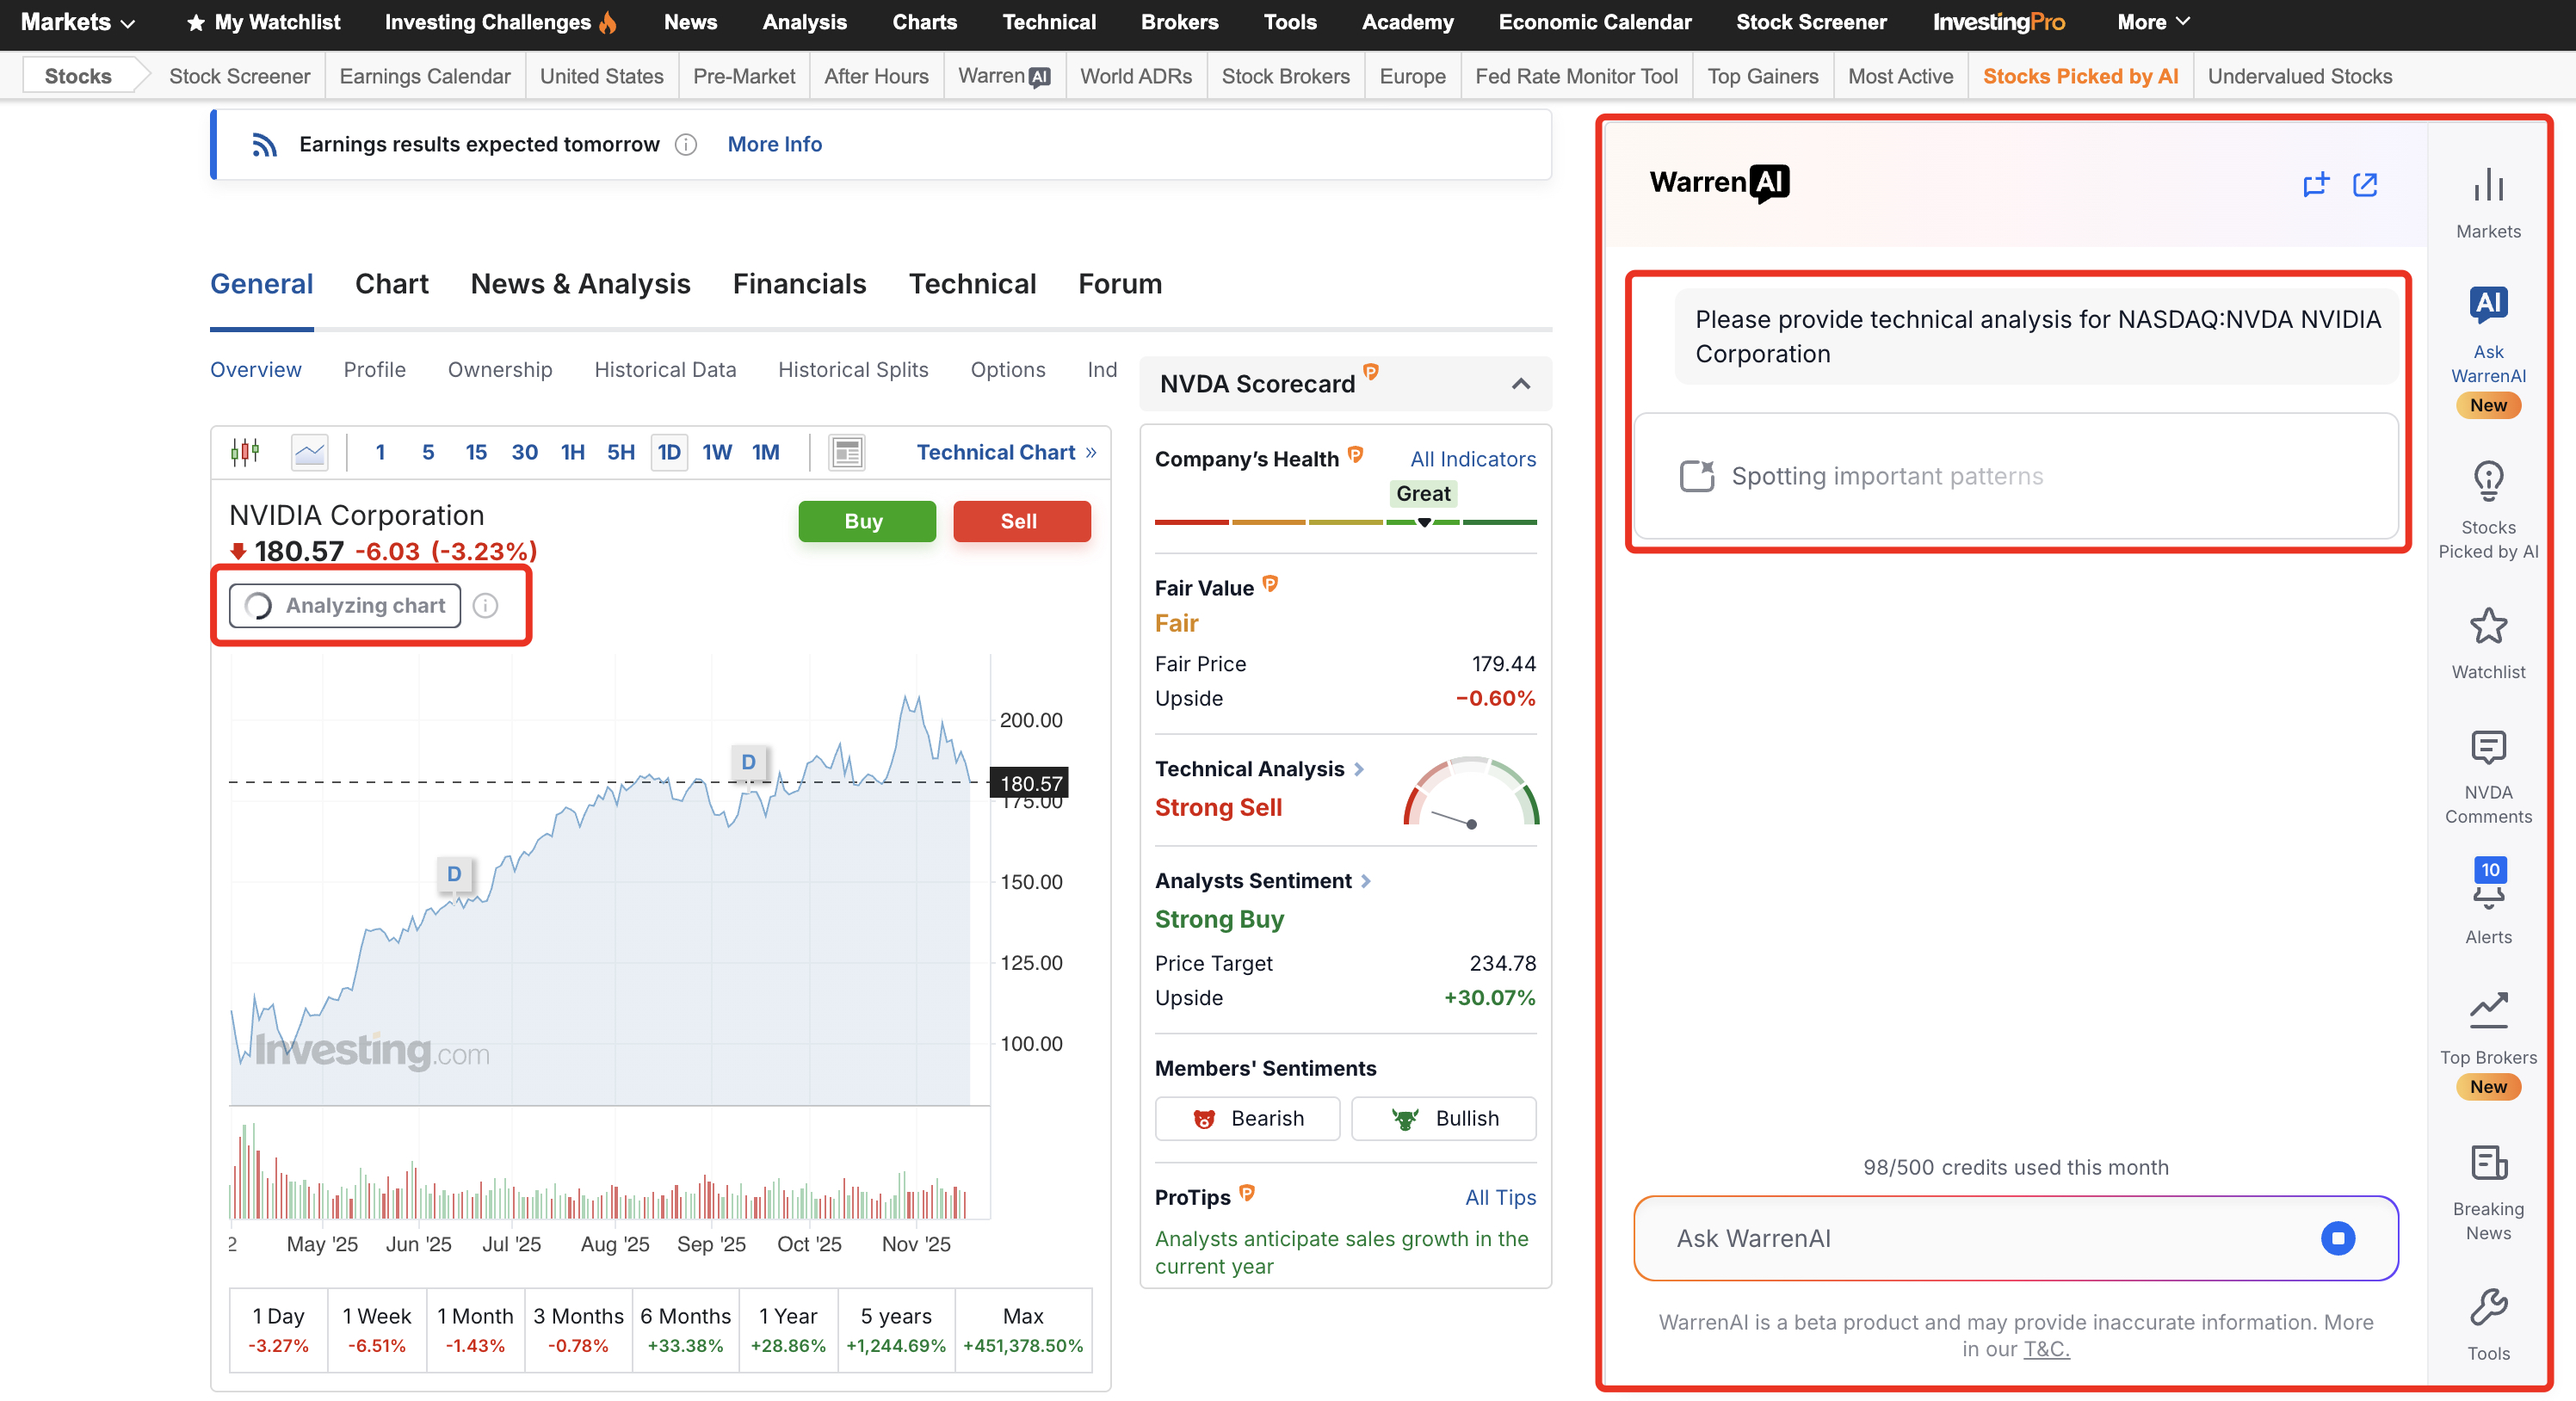
Then comes the crucial click: “Start AI chart analysis”—right below the price within the chart.
The WarrenAI widget gets to work on the right-hand side.
 Source: Investing.com
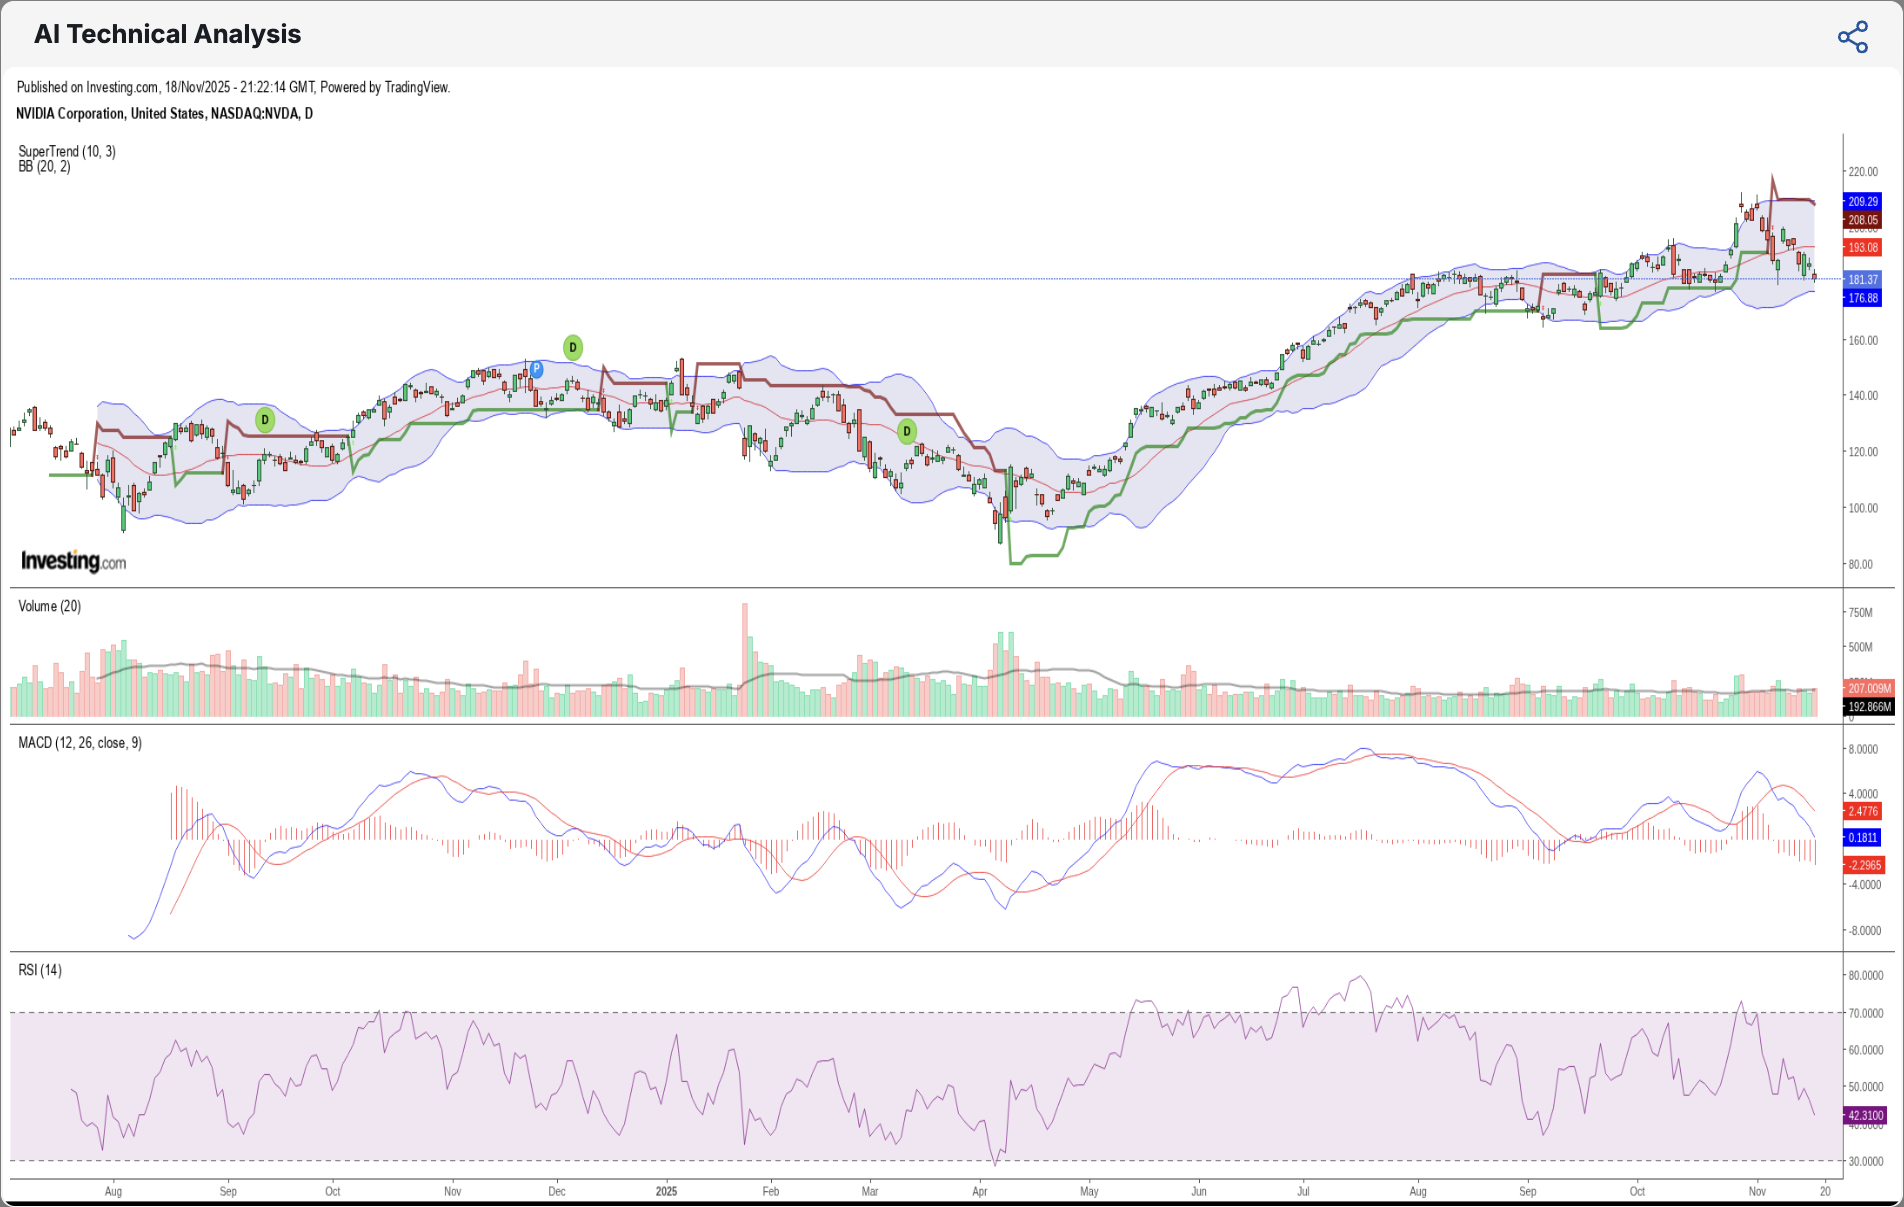
Warren AI processes several indicators at once (three to five), including RSI, MACD, SuperTrend, volume flows, and Fibonacci clusters, while simultaneously scanning for classic chart patterns like head-and-shoulders formations, bullish flags, wedges, and triangles.
All of this happens in a matter of seconds and is then condensed into clear zones, scenarios, and action options. Specifically, this means for you: no flood of indicators, no guesswork – the AI filters out the 3 to 5 signals that are REALLY relevant for traders from hundreds of possible signals.
- Still not an InvestingPro member?
Subscribe to InvestingPro for the lowest price OF THE YEAR NOW and get up to 100 AI-powered technical analysis per month.
What WarrenAI currently sees in the Nvidia chart
Let’s now take a look at what WarrenAI is currently seeing on Nvidia’s daily chart.
The AI summarizes the situation as follows:

Source: WarrenAI
The stock closed yesterday at $181, currently trading right at the upper edge of a strong support zone. At the same time, however, Nvidia is trading below several trend lines, including the 20-day and 50-day moving averages and the SuperTrend indicator. This creates a volatile environment, with the price concentrated around a few crucial levels.
The AI identifies three zones that currently define the “playing field”:
Below is the area around $180, where enormous trading volume converges,including the September low and a Fibonacci retracement.
Above is the block of $186, $193, and, finally, around $205, where the following trend barriers lie.

Source: WarrenAI
Interestingly, the expected earnings movement of approximately ±7% fits almost exactly between these levels. WarrenAI thus clearly demonstrates where the price needs to move to generate a genuine signal.
Three core scenarios that WarrenAI derives from the current situation:
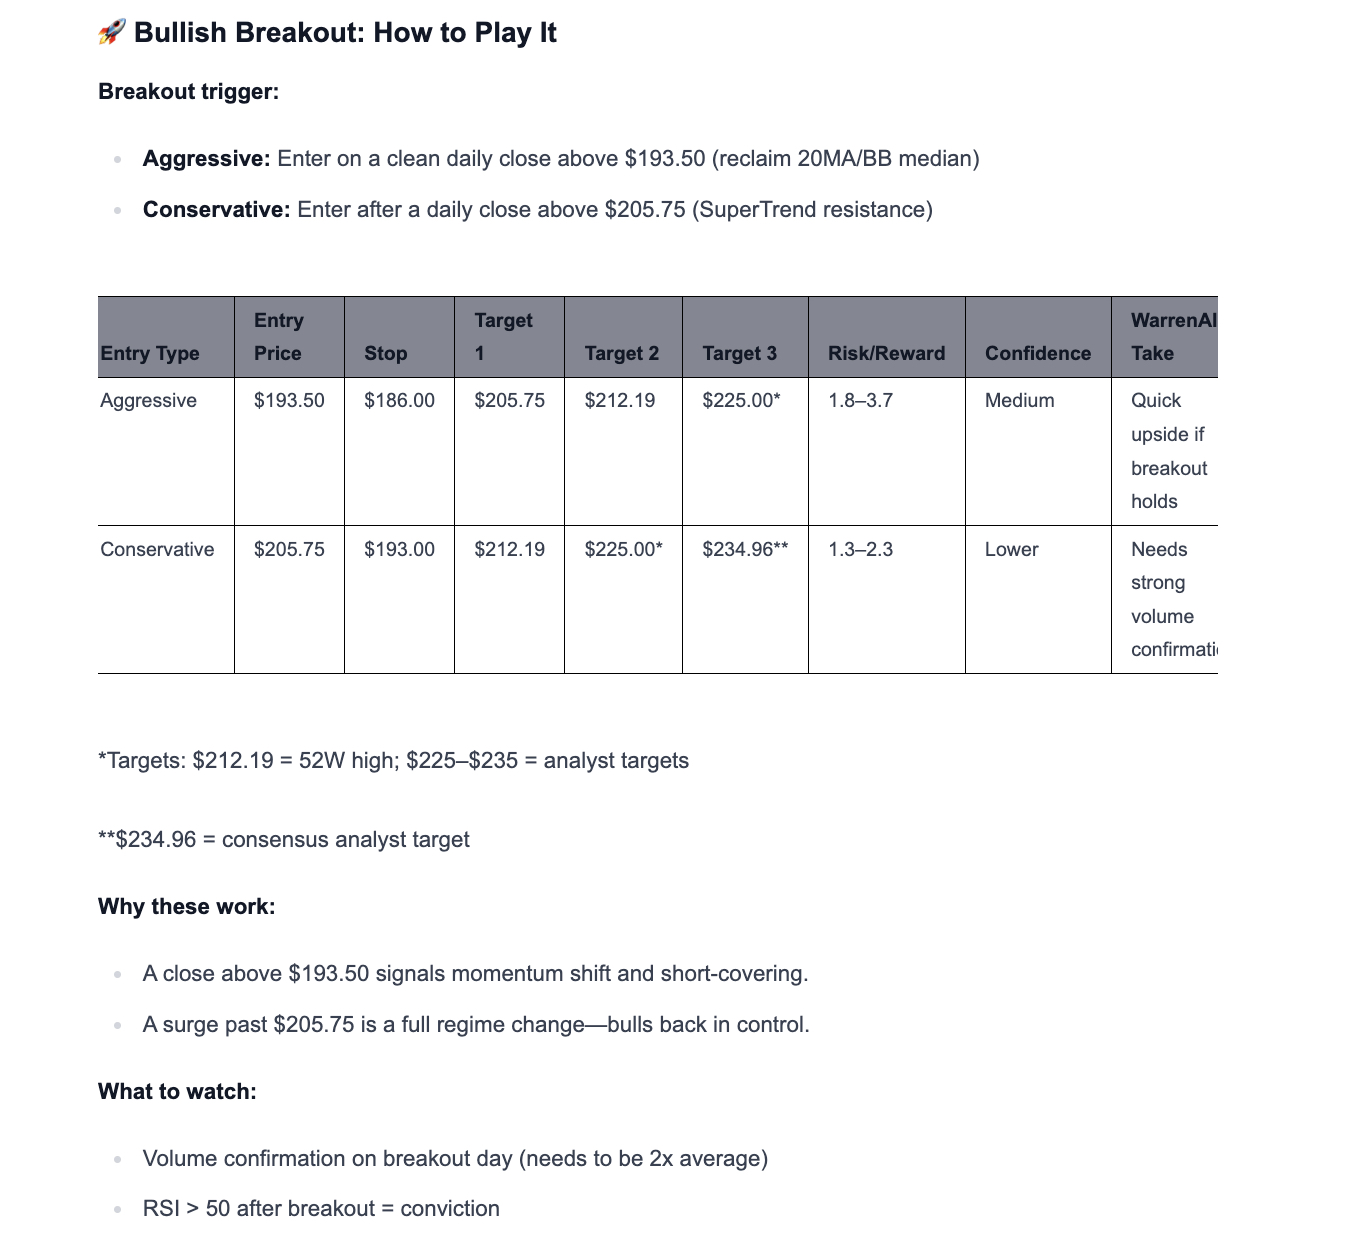
Instead of simply drawing a few lines, WarrenAI breaks down the situation into concrete trade ideas as usual – with chart, entry, stop, risk-reward ratios, confidence level and possible targets.
Source: WarrenAI
1. Breakout long above the trend cap
Source: WarrenAI
If Nvidia closes above the $193 to $194 range, WarrenAI sees real upward momentum emerging for the first time.
“A close above $193.50 indicates a momentum shift and short covering.”
The actual “regime change”, as the AI calls it, only happens above the zone around $205 :
“A closing price above $205.75 signifies a complete trend reversal in favor of the bulls.”
According to AI, classic targets then open up again: the 52-week high, then the first analyst ranges in the mid-220s.
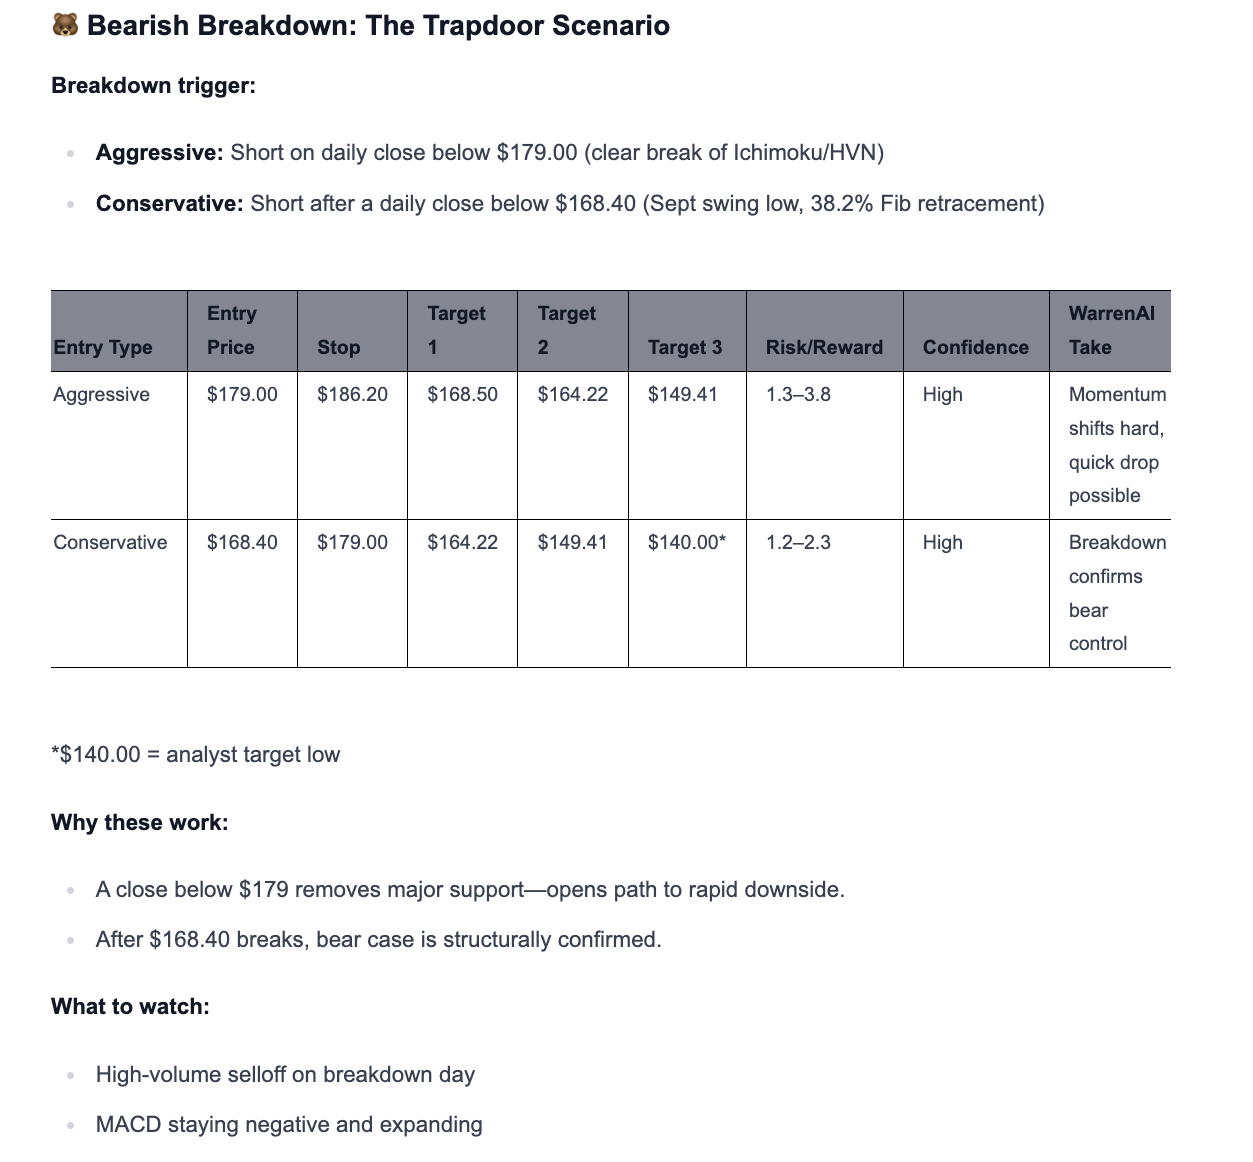
2. Reversal short position upon breaking of support levels
Source: WarrenAI
On the downside, the AI focuses on a single point: $179. If Nvidia falls sustainably below this level, WarrenAI predicts that “the supporting base” on which the price currently rests will disappear. After that, the path opens up towards $168 and later $150.
“A close below $179 removes the most important support level. Below $168.40, the bear case would be structurally confirmed.”
This line has a significant influence because several technical systems coincide there: Ichimoku cloud, volume cluster, and trend channel.
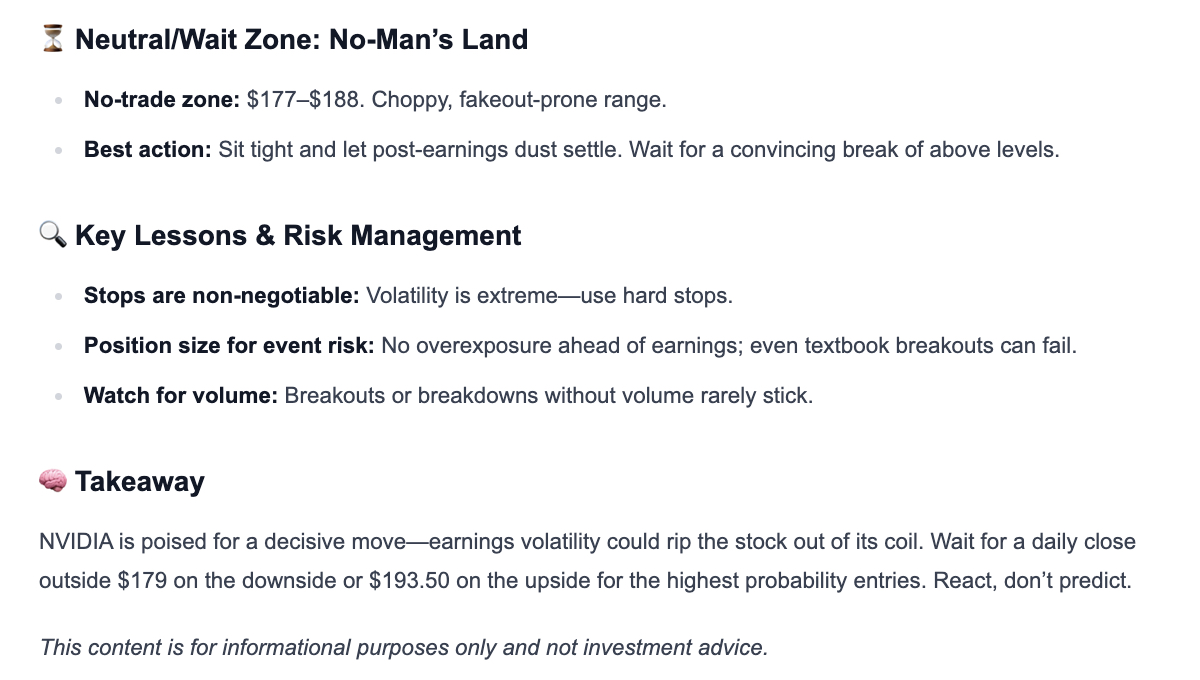
3. The unattractive middle ground – or: Where WarrenAI advises against it
The AI currently sees no meaningful setups between approximately $177 and $188 . The price is fluctuating, but nothing is significant.
“This range is predominantly prone to fakeouts. Patience is more profitable here than knee-jerk reactions.”
Source: WarrenAI
Why is this preferable to decision-making based solely on gut feeling?
The exciting thing about AI chart analysis is that it doesn’t do your thinking for you, but it brings order to the chaos.
Instead of reading through 15 contradictory X-threads about Nvidia, you can get it all with one click:
This is especially valuable around earnings announcements, when stock prices often jump by double digits in seconds. You can define in advance: “If scenario A occurs, I’ll do X. If scenario B occurs, I’ll do Y. If neither occurs, I’ll do nothing.”
This objectification of your decision-making process is precisely the great advantage of WarrenAI.
Technology + fundamental data + idea flow – all in one tool
The best part: Warren AI is just one component of InvestingPro.
You can directly combine WarrenAI’s chart scenarios with:
Fair value assessments,
Quality check for the business model,
fundamental charts and WarrenAI Takes ,
Over 1,400 Pro-Research reports with bull and bear cases on US stocks,
and the ProPicks AI strategies with over 80 approaches in 28 regions, providing you with hundreds of tradable ideas every month.
For example, you can:
NVDA is technically classified as Vision AI,
Look at the fundamental fair value,
Check how healthy the balance sheet and cash flows are,
and compare the stock in the context of other AI beneficiaries – all in one setup.
Conclusion: Nvidia is the test – WarrenAI is your tool
Whether Nvidia will ignite another AI rally after the US stock market closes today, or whether skepticism towards AI trading will continue to grow, nobody knows. One thing is sure: volatility is coming.
The question is therefore less “What is Nvidia doing?”, but rather: “How well prepared are you for the possible scenarios?”
With WarrenAI, you have a tool that helps you structure this volatility, with clear zones, concrete scenarios, and a clean risk framework.
And because InvestingPro is currently discounted by up to 55% in the Early Bird Black Friday deal, now is the perfect time to seriously test it – whether you are a long-term stock investor or an active day trader.
Here’s a walkthrough on how to get the best from Investing.com’s new AI-powered chart analysis feature:
Important:
An analysis costs 5 tokens.
As a Pro member you get 50 tokens per month , as a Pro+ you even get 500 tokens .
With a free account you receive 10 tokens , which allows you to test at least two full chart analyses. All you need is registration, which is completely free!
And since InvestingPro is currently up to 55% cheaper in the Early Bird Black Friday sale, getting started is currently as cheap as it has rarely been.
Disclaimer: Subscription prices mentioned in articles are accurate at the time of publication. We regularly test different offers for our members, which may vary by region.


